This piece is a guest contribution by Darrin P. Jolly. Darrin is a recent Valedictorian from the Bachelor of Science in Recording Arts program at Full Sail University. Currently completing a Masters of Science degree in Game Design, Darrin is conducting research on the applied influences audio has in saccadic time performance.

Abstract
This experiment was designed to measure the influence audio has on the saccadic response time of users viewing a two-dimensional plane. With potential applications for augmented reality (AR) and virtual reality (VR) platforms, it must be understood that neurophysiologic processes can be difficult to grasp, and designing studies to assess these can be complicated to construct. This pilot test was conducted to see if primed audio impulses improve saccadic responses as opposed to no impulse. Once the data was coded and results analyzed, the significance was not only relevant but also quite intriguing.
Introduction
Interactive sound designers have an obligation to users when introducing them into their pseudoacoustic worlds. Audio professionals must understand that every choice made while constructing a soundscape has the possibility of affecting the users physiologic performance. This responsibility has never been more important to the user experience as the craft of sound design moves into AR and VR platforms and engineers experiment with various 3D audio spatializers. Sound pressure levels and particle velocities provide significant amounts of sensory data that aid in acoustical source localization. This data must be considered when analyzing the express saccade movements of individuals and the influence audio has on that relationship. Expectations of this research are to better define these influences, which may lead to clearer terminology and communication between designers and other industry professionals about the rising importance of interactive sound design in AR/VR applications.
Background
A saccade can be described as the ballistic movement of eyes between visual fixation points. Once this function is underway it cannot be stopped voluntarily. When an individual wants to track an object of interest consciously, this is known as an express saccade. Knox and Wolohan (2015), conducted a series of studies that concluded individuals demonstrate a pattern of express saccadic behaviors that is consistent and improves with training in their oculomotor phenotype. With baseline reaction values of 126 +/- 14ms reduced to 107 +/- 8ms, the results were impressive but lacked the benefits of implemented audio. Considering neural processing speeds in general, even several milliseconds can be quite significant.
Hypothesis and Methods
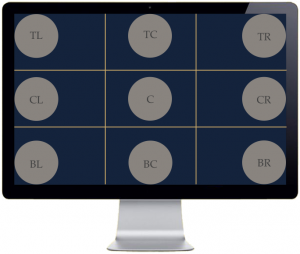
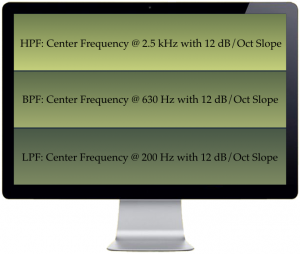
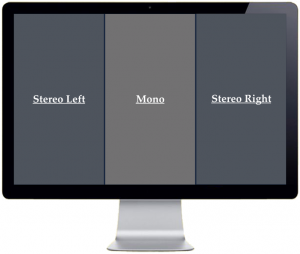
The proposed hypothesis was that auditory impulses that prime visual stimuli reduce individual saccadic times. An acoustically isolated room was utilized and outfitted with the appropriate biometric equipment. Saccadic time performances were measured using Tobii Pro eye tracking glasses. Given a brief set of instructions, the participants were placed 60cm away from the display monitor and donned eye tracking glasses and headphones. The investigator began the test video consisting of twenty-seven visual impulses that could propagate in one of nine possible locations (Image A). The visual stimuli were filled grey circles (RGB – 65,68,87) measuring 4.8cm in circumference on a dark blue background (RGB – 0,17,39). Each visual stimulus was preceded by an auditory impulse 100ms prior to propagation. The auditory impulse consisted of pink noise, 300ms in duration, filtered, and panned in a manner specific to the visual impulse location. Visual stimuli appearing on the lower third of the display monitor would contain priming auditory impulses processed with a low pass filter, center frequency of 200Hz at a 12 dB/Oct slope; middle third – band pass filter, center frequency of 630Hz, 12 dB/Oct slope, upper third – high pass filter, center frequency of 2.5kHz, 12 dB/Oct slope (Image B). Visual stimuli appearing in the center of the display monitor contained a mono auditory impulse; appearing right – auditory impulse panned 100% right, appearing left – auditory impulse panned 100% left (Image C). Auditory impulses were brought to an equal loudness of 85dBC SPL. Each test was one minute and fifteen (1:15) seconds. Upon completion, the participant was released for debriefing.
Analysis
Response and accuracy times toward each individual stimulus were recorded by frame at a 60fps timecode. The mean of each data set was calculated of its respective participant and separated by those exposed to the test with audio and those without for comparative analysis. A T-test was employed to measure significance, and their means displayed on a marked line graph. This gave the ability to view and compare each visual impulse and the reaction times of the averaged participants performance over the duration of the test.
Results
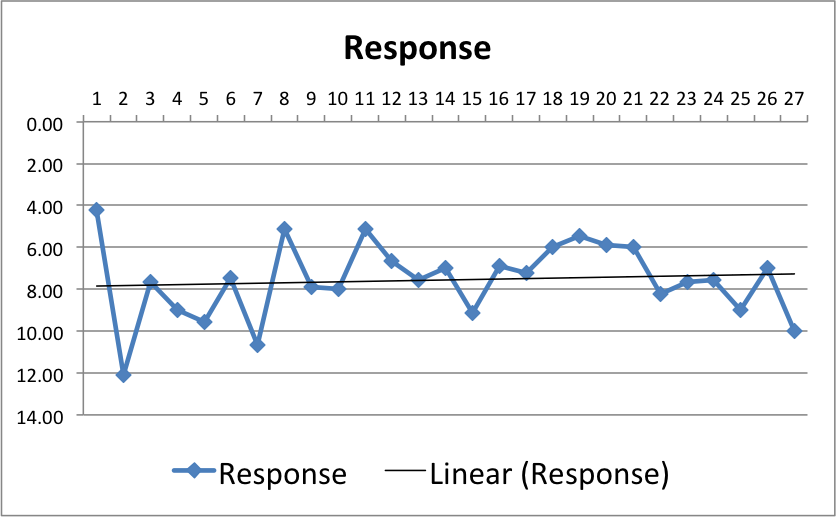
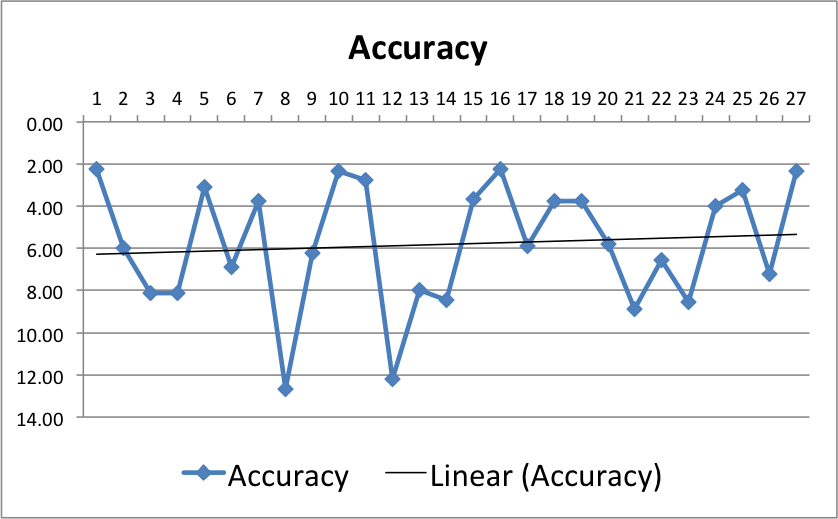
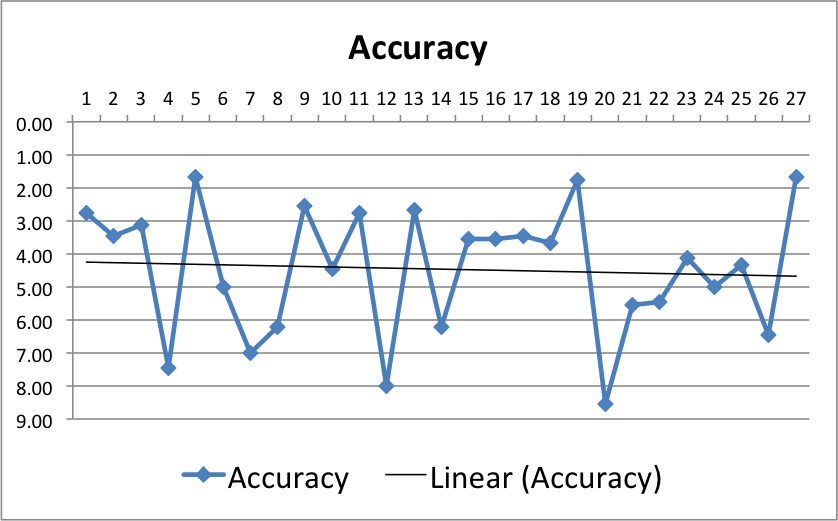
Data were compiled from a total of eighteen participants. The “With-audio Priming Group” (N=9) was associated with a response time (Graph I) M = 7.56 frames (SD = 1.81) and an accuracy time (Graph II) M = 5.81 frames (SD = 2.94). By comparison, the “Without-audio Priming Group” (N=9) was associated with a response time (Graph III) M = 10.84 frames (SD = 1.37) and an accuracy time (Graph IV) M = 4.46 frames (SD = 1.95). To test the hypothesis that participants exposed to the experiment with audio priming would have lower saccadic time performances in response and accuracy, an independent samples t-test was performed. All distributions were sufficiently normal for the purpose of conducting a t-test (i.e., skew < |2.0| and kurtosis < |9.0|; Schmider, Ziegler, Dana, Beyer, & Buhner, 2010). Following a confidence interval of 95% (α = .05) as a criterion for significance, all p-values satisfied set thresholds (Response – p < .001, Accuracy – p .054).
With Audio-priming Group
Graph I. AVERAGED RESPONSE TIME OF PARTICIPANTS EXPOSED TO PRIMING AUDIO CUES OVER THE VISUAL STIMULUS PROPOGATION ORDER.
Graph II. AVERAGED ACCURACY TIME OF PARTICIPANTS EXPOSED TO PRIMING AUDIO CUES OVER THE VISUAL STIMULUS PROPOGATION ORDER.
Without Audio-priming Group
Graph III. AVERAGED RESPONSE TIME OF PARTICPANTS NOT EXPOSED TO PRIMING AUDIO CUES OVER THE VISUAL STIMULUS PROPOGATION ORDER.

Graph IV. AVERAGED ACCURACY TIME OF PARTICPANTS NOT EXPOSED TO PRIMING AUDIO CUES OVER THE VISUAL STIMULUS PROPOGATION ORDER.
Discussion
As expected, the results showed response times of participants exposed to priming audio cues were faster than those not exposed. Unexpectedly, accuracy times were not improved. This unexpected outcome could be explained by a linear speed-accuracy trade-off in saccadic eye movement model expressed by Abrams, Meyer, and Kornblum, (1989). It is common for saccadic impulses to fall short or over extend their intended target. This variability in saccadic undershoot and overshoot is increased when saccadic speed is increased. As shown in the above analysis it would be appropriate that the faster response participants would display attributes following the speed-accuracy trade-off model. This effects accuracy times due to the compensation that must occur to correct an overshot or undershot express saccade toward the visual stimulus.
Closing Remarks
An important purpose of conducting research like this is to better understand and define the constructs and limitations of our craft as we move into AR/VR platforms. Even though this experiment was conducted on a two-dimensional plane with in a stereo field of simple audio implementation techniques, its purpose was to show a baseline significance of audio influencing saccadic performance, which it did. Moving forward, a proposal for the above experiment has been submitted to an Institutional Review Board, which will allow formal process oversight and improved preparation for journal publication. There are plans to apply this methodology to AR/VR platforms to better understand their pseudoacoustic impact on the physiologic performance of users. There is a new frontier of interactive sound design and expectations are set high. In order to have a fully immersive AR/VR experiences, it lies on our shoulders to get it right. If you have any questions feel free to reach out through www.kneedeepaudio.com.
References
Abrams, R., Meyer, D., and Kornblum, S. (1989). Speed and accuracy of saccadic eye movements: characteristics of impulse variability in the oculomotor system. Experimental Psychology, 15(3), 529-543.
Knox, P., Wolohan, F. (2015). Temporal stability and the effects of training on saccade latency in “express saccade makers”. PLoS ONE, 10(3), 1-16. doi: 10.1371/journal.pone.0120437
Schmider, E., Ziegler, M., Dana, E., Beyer, L., & Buhner, M. (2010). Is it really robust? = reinvestigating the robustness of anova against violations of the normal distribution ssumption. Methodology, 6(4), 147-151. doi: 10.1027/1614-2241/a000016.
A big thank you to Darrin P. Jolly for contributing this piece. You can find out more about Darrin and his work at www.kneedeepaudio.com and you can find him on Twitter @darrinjolly.